


CSR can't be invented or improvised, it can't be done with a finger in the air, because the emission and impact factors are sometimes far removed from what our common sense andintuition would suggest. It is carried out by experts according to well-thought-out, official, shared and constantly improved protocols such as the Bilan Carbone, theAnalyse de Cycle de Vie, or theEmpreinte Carbone, and is based on dynamic databases that are constantly updated, as well as on internal company information.
At L'Arbre à Café Café, we have chosen - and this is one of our commitments as a Société à Mission and B Corp- to carry out both our carbon footprint and the carbon footprint of one of our coffees, our best seller. The idea is not to be the best, as these are not comparative exercises, but to improve, or as B Corp puts it, "the ambition is not to be the best, but to be better".
While the Bilan Carbone looks at all the emissions generated by a company's activity according to 3 major scopes, the carbon footprint is the sum of the emissions caused by the life of a single product,from its manufacture to its end-of-life.These are two distinct but equally complex, exhaustive and informative exercises.
In calculating the carbon footprint, for each stage the associated emissions are calculated either by data collected internally(we'll come back to this later), or by data available in the bibliography and reference studies orin recognized and certified databases such as Ademe or Agribalise.
While the LCA takes into account 4 indicators, thecarbon footprint only concerns CO2 emissions. We chose EcoAct to accompany us the first time, and Aktio in autumn 2024.
Which coffee did we choose?
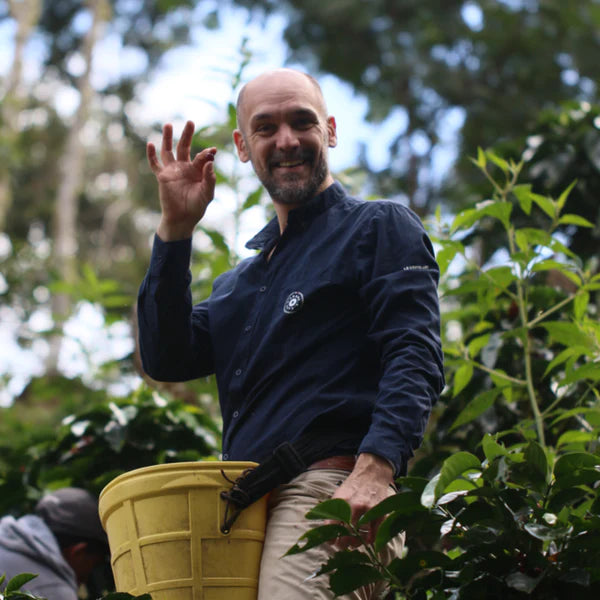
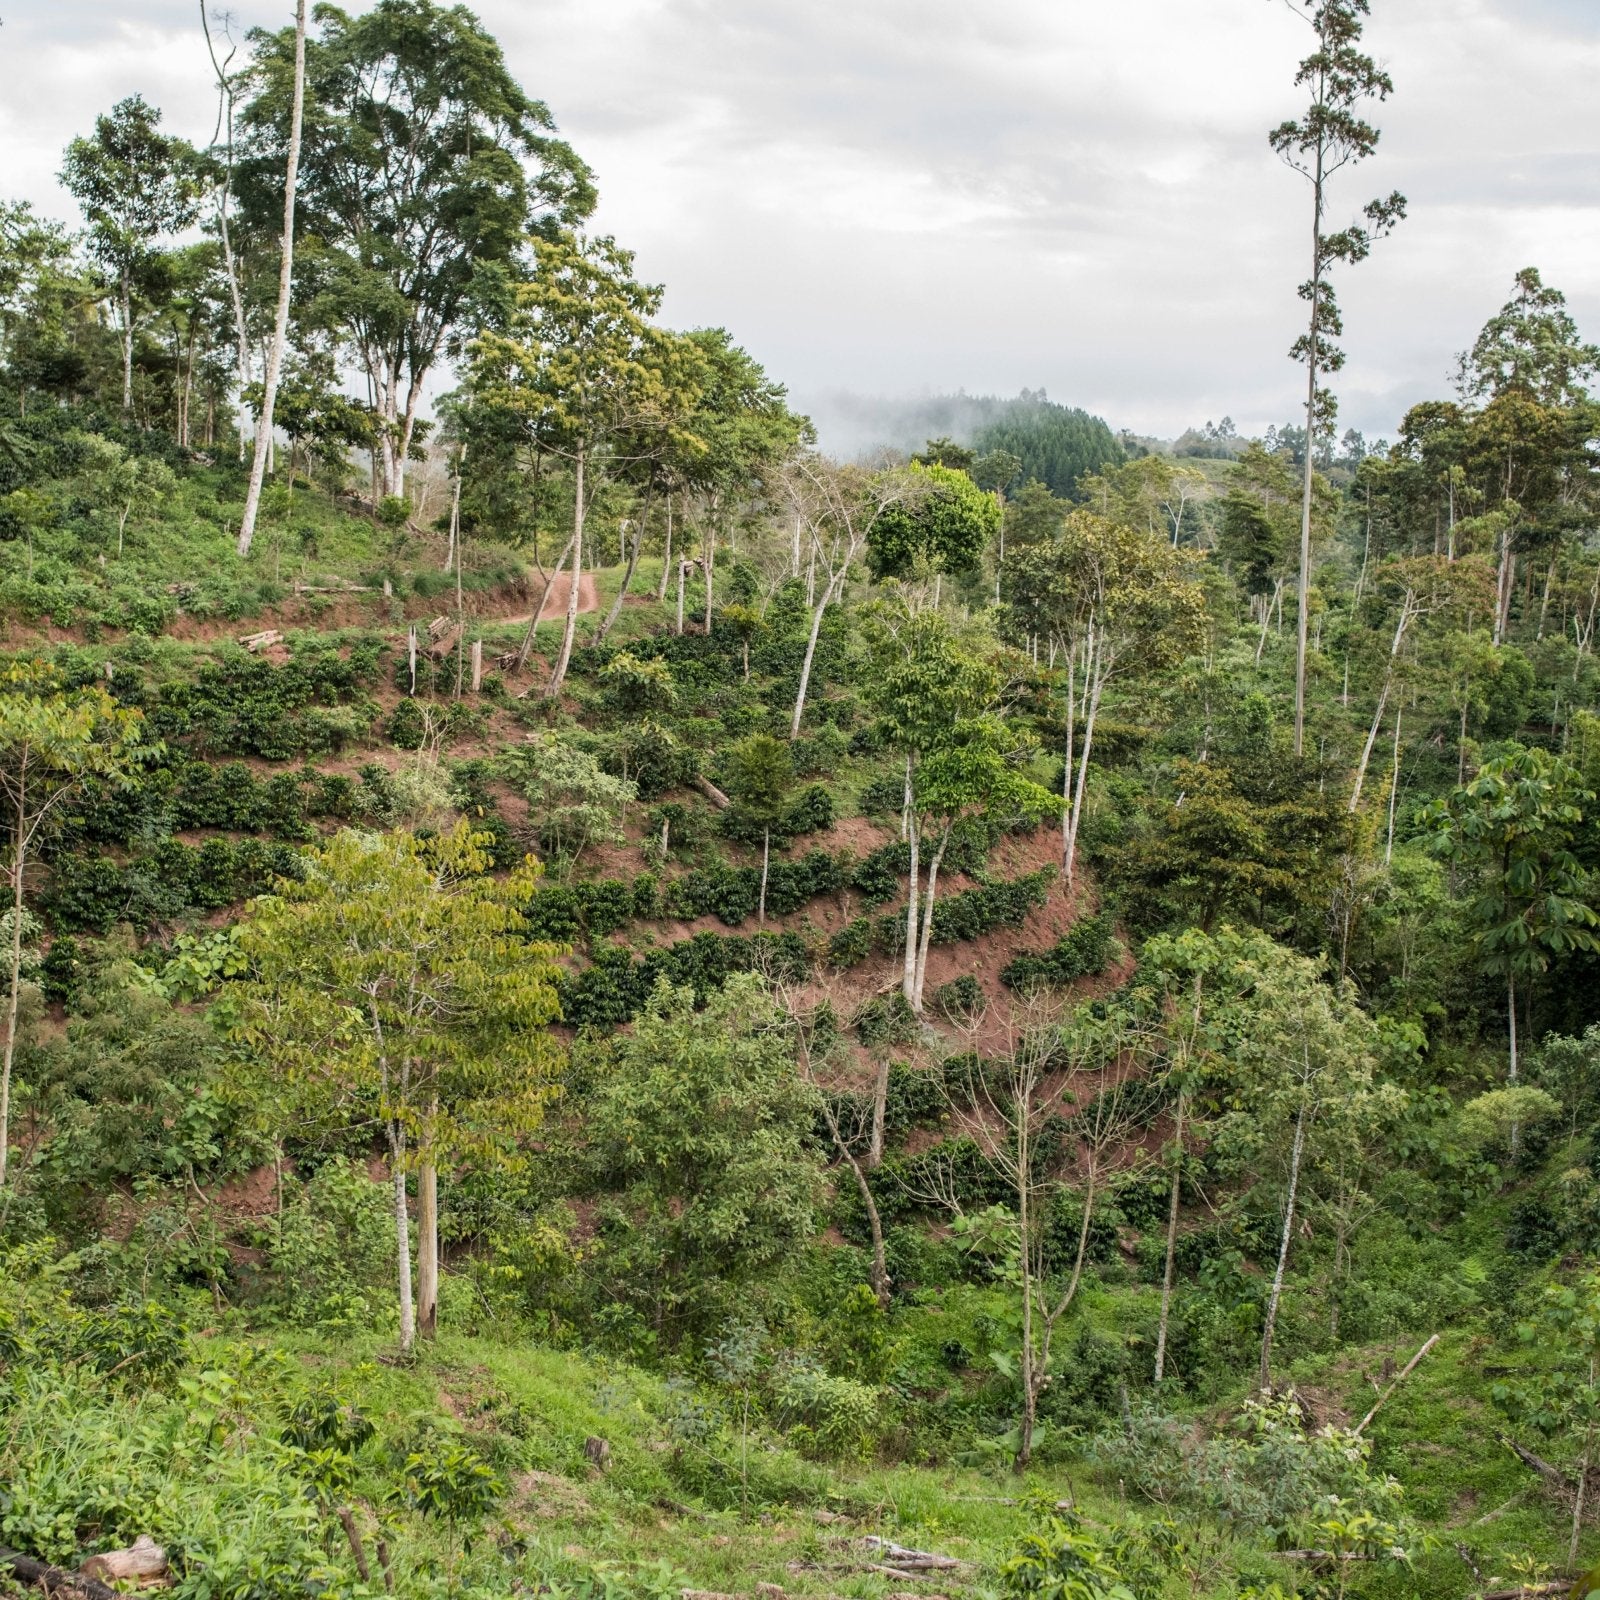
While only a handful of companies manage to calculate the carbon footprint of many, if not all, of their products, on the scale of an SME, the best practice is to choose the most emblematic and/or best-selling product. This is the logic we adopted when we chose both our best-seller AND our most emblematic coffee,which comes from our own plantation, Finca Mariposa.
So that's the carbon footprint of the Blue Mariposaquewe made.
What data do we use?
To collect the data and make the calculations, we gathered as much in-house data as possible, often also used for the Bilan Carbon, and Aktio highlighted and supplemented them with official databases.
Thus, data concerning all the stages that we control in-house, such as farming practices, importing, roasting, sales and extraction, are data derived from our measurements and monitoring.
On the other hand, data that we don't have, such as the carbon ton/km/weight equivalent of sea freight, or those concerning the manufacture of machines or their end-of-life, come from official databases.
The idea is to be as close to reality as possible, so as to be able to individualize improvement points. In-house data is not necessarily better than database data.
- This is particularly true of machine manufacturing. We use the only machines that have undergone an LCA and therefore a CO2 optimization, the Victoria Arduino. But the carbon footprint provided by the Italian manufacturer is higher than the data provided by Ademe, the French Environment and Energy Management Agency, which proposes an average combining small domestic machines and professional machines, filter machines and espresso machines. In this case, we have obviously kept the supplier data.
- As far as agriculture is concernedthe comparison with standard data is a great point of satisfaction for us.
- The case of electricity is also very telling. As nuclear power is evaluated as the least carbon-intensive energy source (the construction and dismantling of power plants is not included), it is used as a reference in the calculation of the kw in France. Our commitment to green electricity, 100% hydroelectricity or plant-based gas, has no impact on the carbon footprint calculation. It does, however, allow us to measure the environmental efficiency of our practices.
What is the usual carbon footprint of a café?
The average carbon footprint of a café, which is not intended to be compared except internally on a diachronic basis, with an equivalent protocol. This enables us to measure the improvements achieved.
We must therefore be cautious about quick comparisons and sweeping conclusions.
Here are a few shared examples:

Source: The carbon footprint generated across the life cycle of coffee, preparation of different coffee forms and brewing methods. (Luciano Rodrigues Viana)
What's the point of calculating a carbon footprint?
This essentially serves to give an order of magnitude and to point out areas for improvement. What are the most important emission factors and where can I act most effectively? I refer you to our article on sailing freight.
How did we do?
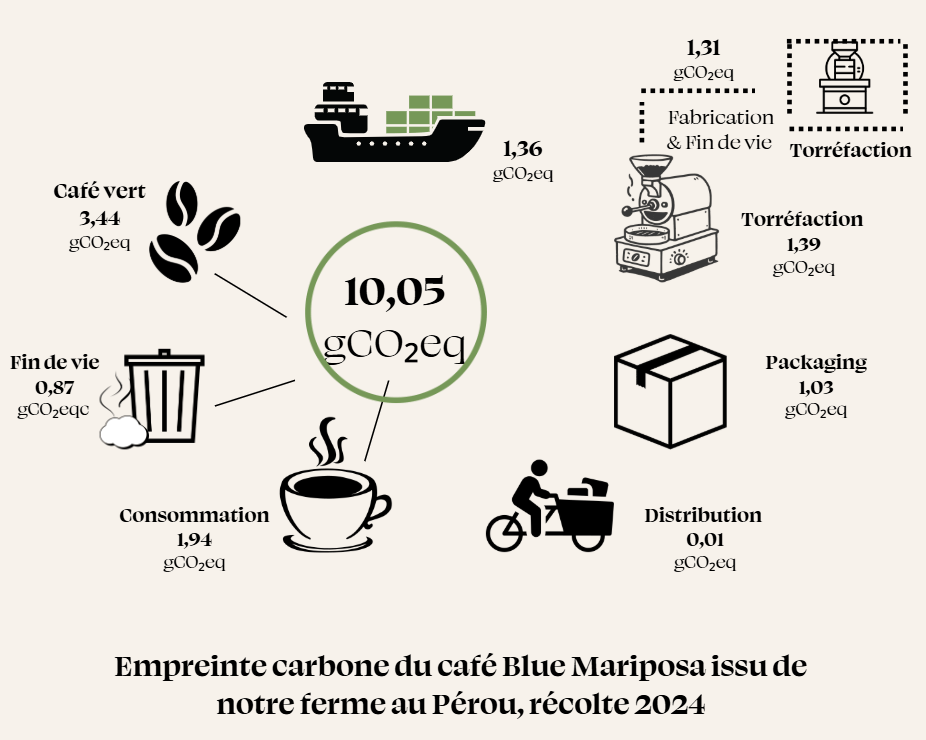
10.5g per cup!
It's excellent and we're very proud of it.
The breakdown is as follows:

Source : Aktio
What are our strong points?
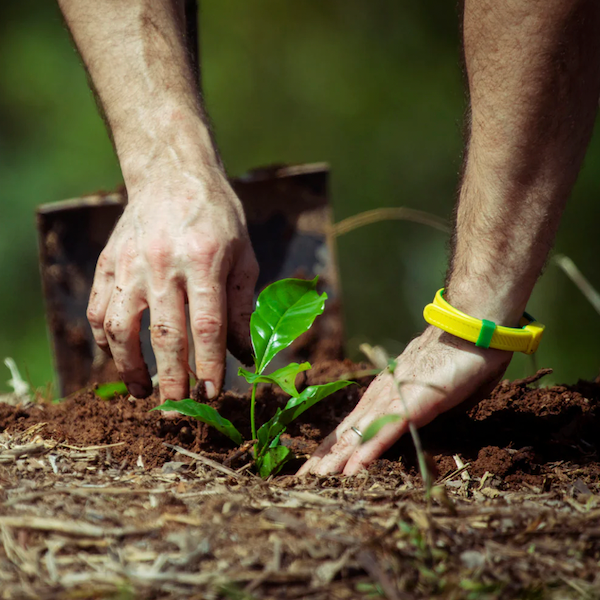
Agriculture is undoubtedly our strong point. While it very often exceeds 50g per cup, the practice of biodynamics with its drastic reduction in agro-chemical inputs, the absence of irrigation and motorized machinery is bringing our emissions down. Long live regenerative farming!
Distribution, which we also master, is one of the areas we've worked on the most, and it shows!
Last but not least, the choice of energy-efficient equipment is also a major factor in reducing emissions.